Ossus
August 2019
FIRST Robotics Competition scouting platform.
.](https://trevnels.github.io/processed_images/scouting.f119faa82bb53101.jpg)
What is FRC scouting?
If you’re not familiar with the FIRST Robotics Competition, you may be wondering what scouting is and why it’s important. Here’s a quick rundown:
In the FIRST Robotics Competition, events are broken into two stages. Qualification matches, the first stage, are 3v3 matches where each alliance of three teams is selected near-randomly. These qualification matches are used to rank teams solely based on win/loss ratio (and some other things, depending on the year.) The second stage, the playoffs, follow a standard bracket of eight 3-team alliances (in recent years, this has changed to a double-elimination bracket.)
After Qualification matches, the top 8 qualification-ranked teams become playoff alliance captains, and go through a complex procedure of picking other teams at the event to join their alliances for the second stage of the event. These alliances stay together through the playoffs until they are either eliminated in the bracket or win. The main objective of scouting is to help teams decide who to pick for their alliance during this selection process to maximize their chances of winning the event. You may be thinking:
Simple! The alliance captains just choose the highest ranked teams after qualification!
Not so fast. Basing one’s choices on win/loss ratio doesn’t really show the full picture of the teams at the event due to the randomness of qualification matches. For example, a bad team may luck out and be paired with good teams every single qualification match, artificially inflating their qualification rank. They may enter alliance selection with a high rank, but they may not be the best choice. This is where scouting comes in.
During the qualification matches, most teams will have scouts in the stands recording both quantitative and qualitative data on all teams at the event. This data is not only critical for making informed alliance selection picks, but also for making predictions about our future matches and analyzing our opponents’ weaknesses.
Recording all that data and crunching the numbers can get very tedious for the scouts, and even somewhat tedious for an Excel sheet. Therefore, I’ve spent a lot of time during my FRC career trying to improve scouting, both in terms of accessibility to the scouts and in accuracy and usefulness of data flowing out of the system.
Ossus
Ossus is a data collection and analysis web application I built for the task of scouting robots at FIRST Robotics Competition events after we began to outgrow our previous Google Forms-based system during the 2019 season. Ossus is a full-stack application, which is built on a Vue.js frontend, a Node.js/Express backend, and a MongoDB database.
A main concern with scouting applications is network connectivity, since Wi-Fi is prohibited during FRC events due to field interference. Therefore, I designed Ossus with this in mind – it keeps itself cached locally on client devices using a service worker, only communicating with the server through a lightweight REST API. This minimizes bandwidth requirements, so the web client can be used even on a weak cellular connection. Meanwhile, the server does the majority of network-intensive computations requiring data from other API sources, such as The Blue Alliance.
The site was designed to be used by scouts on iPads in the stands at each event, which were connected to a cellular hotspot through Ethernet and a network switch. The Ossus server and database ran on an Ubuntu virtual machine hosted at my high school.
An early version of Ossus was beta-tested at a 2019 off-season event, and I used feedback and feature requests from that test to upgrade almost every part of the system. However, the final 2020 version used was still missing some desired features due to time constraints, largely because I was busy writing code for Overthrow. I would’ve liked to include graphs showing change in team performance over the course of an event, as well as automatically fetching images of team robots from online sources.
The name Ossus is a reference to the Star Wars universe, where a planet by the same name is home to the Great Jedi Library.
Schema
In Ossus, each FRC game (year) is defined by a JSON file called the schema, which defines what objectives teams are able to complete in that game. All the Ossus UI is procedurally created based on this to minimize future development time. Here’s a small snippet of 2020.json:
// ...
"objectives": {
    "powercell_lower": {
      "name": "Lower",
      "icon": "rectangle-outline",
      "color": "#E6CF5C",
      "type": "shoot",
      "destinations": [
        "Lower"
      ],
      "separateAuto": true,
      "pointValues": [
        1
      ],
      "autoMultiplier": 2
    },
    "powercell_upper": {
      "name": "Upper",
      "icon": "hexagon-outline",
      "color": "#E6CF5C",
      "type": "shoot",
      "destinations": [
        "Outer",
        "Inner"
      ],
      "separateAuto": true,
      "pointValues": [
        2,3
      ],
      "autoMultiplier": 2
// ...
I tried to abstract all the historical FRC game pieces into a handful of “types” which all share common properties in terms of data and the means of recording it. For example, the pickplace type defines a game piece which can be picked up and placed at other locations for set point values, a common pattern that appears throughout many FRC games. The schema also defines iconography and colors seen throughout the application to make buttons and statistics more identifiable at a glance.
Data Collection
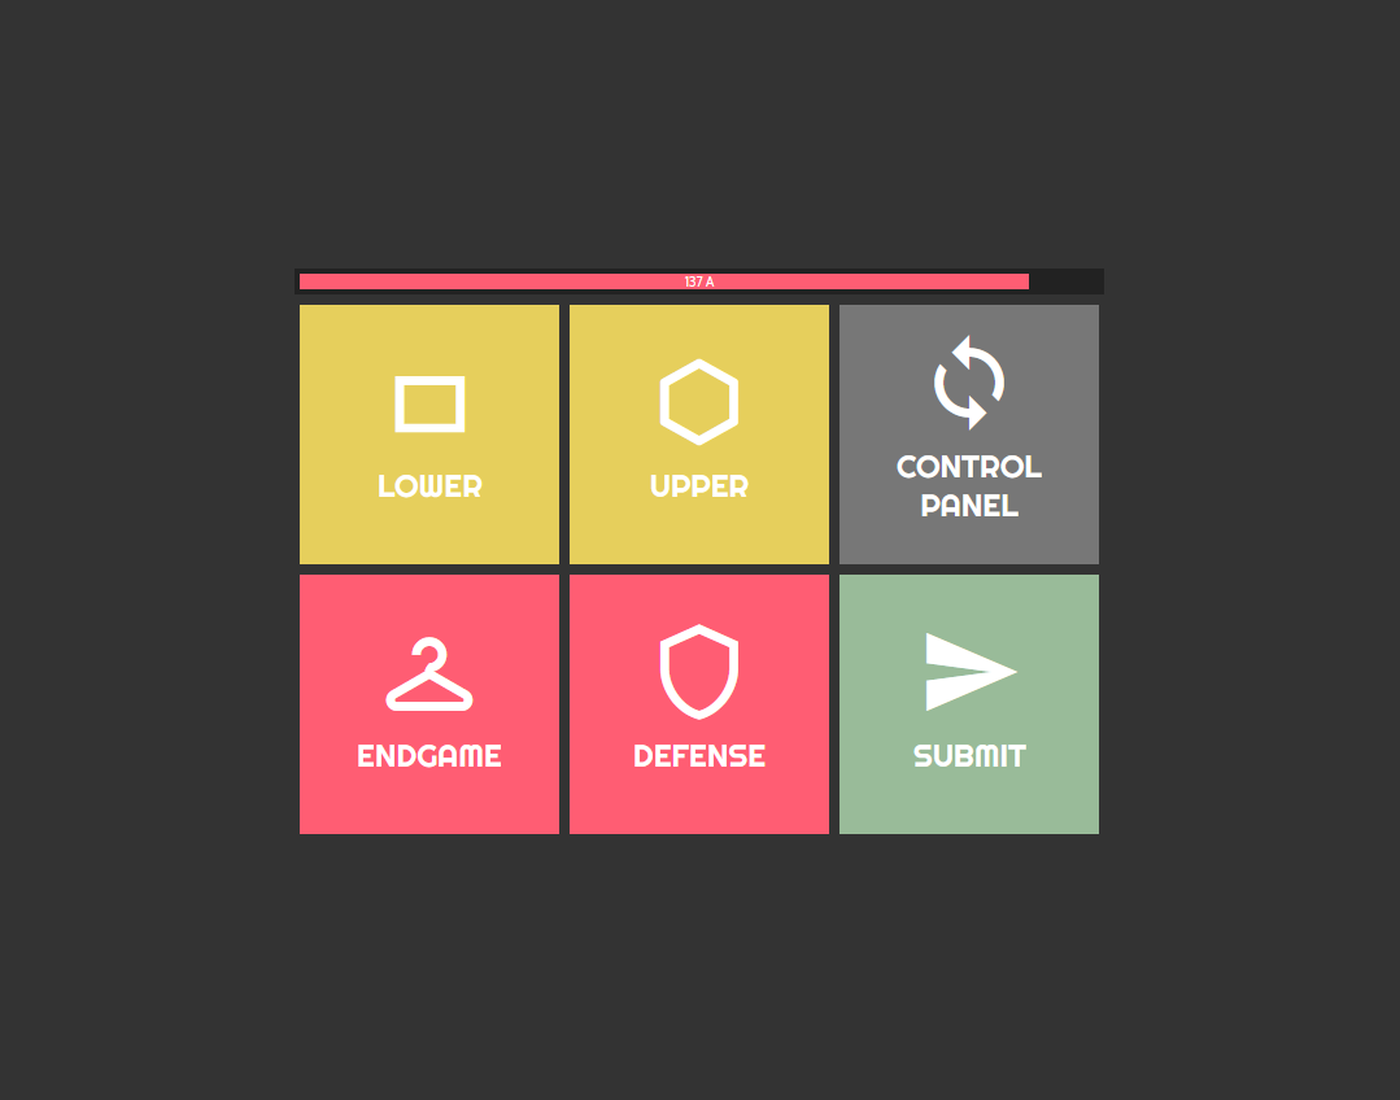
Data is collected with a touch-optimized interface designed for the scout iPads. Scouts simply tap what their assigned robot does, and the screen will update with new options. For instance, pressing endgame would switch to buttons of different possible endgame states. All of these buttons are created based on the provided schema – nothing is hard-coded. Effectively, the data collection interface is a finite state machine of all states a robot could be in, and transitions between these states are triggered by buttons and counted behind the scenes. This data is sent to the server and recorded in MongoDB once the scout hits submit and adds any qualitative notes.
The design of this interface was primarily driven by complaints from scouts about our previous data entry method. Before 2020, we used a Google Form feeding a complex spreadsheet for scouting data. This worked, but the Google Form did not facilitate sequential data entry the same way the Ossus data collection interface does. Having to scroll up and down in a form and manually incrementing values in text boxes quickly wore out our scouts.
Data Analysis
The primary presentation of data in Ossus is via the table above. The left-hand weights menu is used to dynamically sort the table based on a variety of statistics determined by the game schema. This is not just a basic sort, however. Every statistic can be prioritized or penalized with a weight, sorting the table based on how well a team satisfies these weights. For example, I could sort the table by teams who are good at game piece A and game piece B, but A is preferred, and I do not want teams who do game piece C, all by adjusting a few sliders. All of these calculations are performed on the server using scout data recorded in MongoDB. Again, none of this is hard-coded, everything down to the table header is procedurally generated.
The “horizontal bar charts” on the table, as I like to call them, are rendered by my own chart library which uses SVG instead of HTML canvas. I found that popular HTML canvas chart libraries had extreme performance penalties when dealing with hundreds of charts on a page moving around dynamically, so I wrote my own chart library specific to the project’s needs. Each chart can be clicked to flip the bar labels to percentages/values for more in-depth data if needed by the scouts.
Predictions
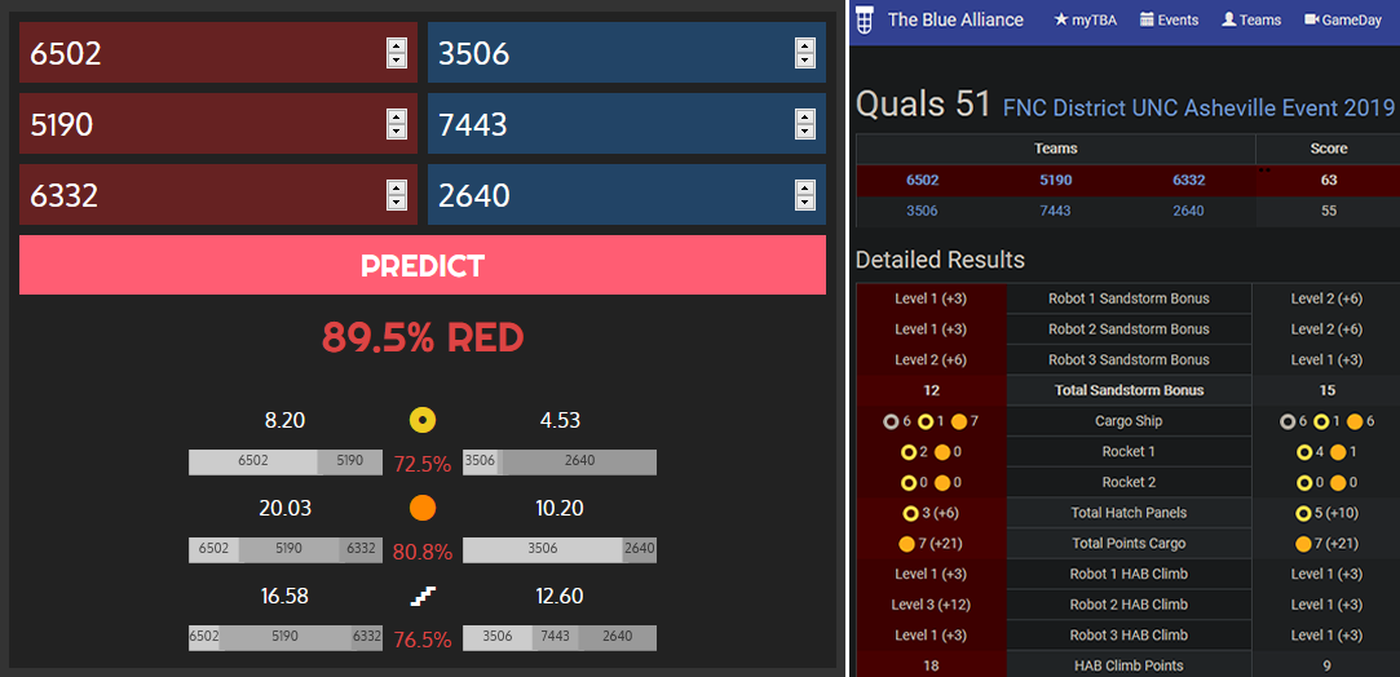
Ossus can also do match predictions based on collected scout data. Above, you can see the prediction algorithm’s output. It computes a win percentage for each alliance, and also computes a breakdown by field element, predicting each alliance’s points obtained from each. It also shows a breakdown of which teams are projected to contribute what to each game piece point total. However, teams will typically change behavior by match based on who they are playing against, so these breakdowns are just estimates. Above, they hold mostly true when compared to the actual outcome, but there are still some conflicts.
Being able to simulate matches between two alliances who have never played together is also critical for alliance selections. We can substitute various teams into an alliance to see which gives the best chance of victory. The breakdowns also help us determine who should assume what role on an alliance based on strengths.
The prediction algorithm works by generating normal curves for each team’s contribution to their alliance’s score, adding them up to total alliance score curves, then subtracting them to generate a score difference curve. From this curve, we use a cumulative density function to get the percentage of this curve that exceeds or falls below zero, with zero meaning a tie. These percentages are the probabilities of one team’s score exceeding the other.